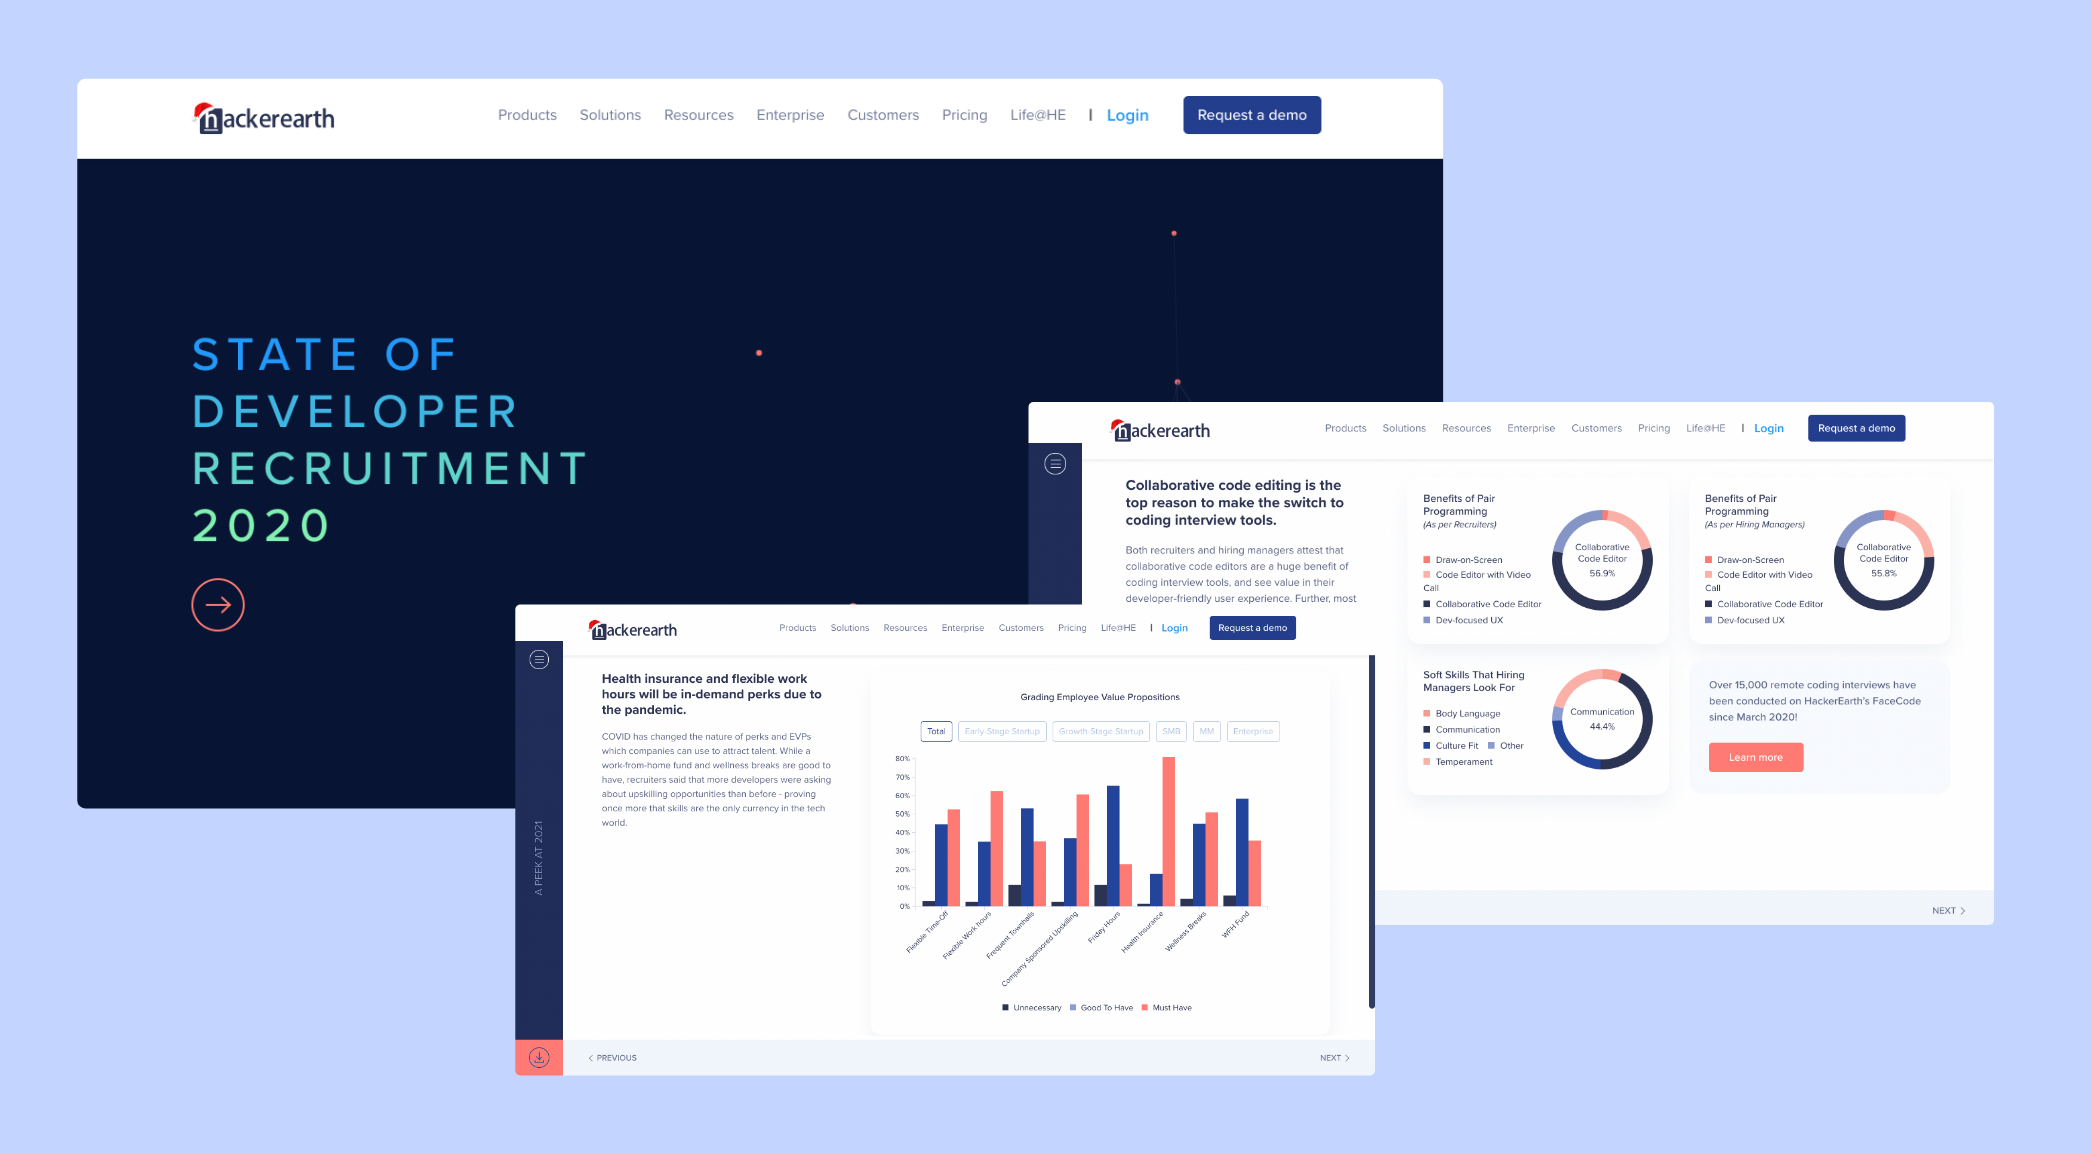
State of developer recruitment 2020 | HackerEarth
Designing a web ready report that shows various data points in the form of graphs and charts for tech recruitment in the year 2020 collected via a survey from over 2500 hiring managers and tech recruiters.
Duration : Nov 2020 - Jan 2021. | Role: UX/UI design, Interaction design. | Tools: Adobe XD, Adobe Illustrator, Google Docs, Jira
Project Overview
2020 was one such year that brought about major changes in the tech recruiting industry and various practices that were prominent earlier were no longer relevant in this remote world for recruiting developers for the companies. Even if the changes were seen prominently, presenting it in the form of evident data was a relevant thing for the company and helpful for the industry of tech recruiter and hiring managers. HackerEarth as a company with a mission to measure and organize the world's technical skill data wanted to bring forth a crucial insight from peers that will help show the changing landscape.
Background and problem statement
A Global survey was created during 2020 to collect data points on recruiting candidates at various companies in the industry. The questions in the survey ranged from sourcing, evaluating assessments to organizing interviews and the kind of challenges that recruiters faced in terms of in demand skills, biases and even importance of personally identifiable information of candidates.
This survey was distributed and data collected was from tech recruiters and hiring managers who worked in Enterprises, Middle markets, growth stage startups, Small to medium businesses and also early stage startups. Using this data to organize, create and design a web ready report that represents the changing scenarios of recruitment in 2020 was the main idea behind the project. Further marketing this project in terms of web ready report, Pdf report, social media posts etc for the adding to the brand value and mission of the company.
Role: UX/UI design, Interaction design, Graphic design (Designing Social media posts)
Tools: Adobe XD, Adobe Illustrator, Google Docs, Jira
Pain Points
The main pain point or challenge was to divide the collected data around questions into categories that represent different stages of recruiting and design the flow of the report.
Including various graphs for the same question by recruiters from SMB, Enterprises, growth stage startups and more under the same page.
Having interactions on the graphs and choosing designs for graphs that are visually aesthetic and easy to understand by the users.
Having an entire menu to navigate to from every chapter.
Design process and my role
As a part of the design team for the marketing i along with my lead had to visually design and create a flow of the report along with showing the categories of the data points with interactive graphs showing them. We brainstormed along with the developers on including the data on graphs that are responsive in nature and came up with the graphs which were easy to understand, visually good and also responsive if a user hovers over it.
The color palette was decided keeping in mind the brand guidelines that HackerEarth already had. Although we were allowed to introduce more color tones to the palette according to the marketing trends, we stuck to the blue tones. We wanted the page to seem like a report and not have an infinite scroll rather in just one fold with screens next to each other. Further, I contributed to designing the project report in pdf format and designing other marketing collaterals for distribution and putting the word out in the market.
User Flow
Flow of the screens
Visual Design
The Developer Recruitment Survey 2020 is made up of responses from over 2500 recruiters and hiring managers in the tech world. HackerEarth put together these responses to showcase the skill-base and trends that are upcoming in recruitment over a wide variety of areas.
The following web report and pdf was created to showcase the same as part of Marketing Design.
Co-owners : Rithul V (Lead creative Visualizer, HackerEarth)
Design Palette
Cover and menu
Social media posts for marketing
As a part of the marketing design team, my role was to create various SM posts and infographics for putting the word out all through the period of collecting survey responses and after releasing the survey report. Collaborating with content team under Marketing was the key to the good reach of all the designs that was put out there over various social media channels.
Here’s the infographic designed for the press release.
Various social media posts for the campaign
Learning points
Collaboration is indeed the key to all
At the end of the day a project like this which represents the mission of the company will have an impact in a much larger way, so working by collaborating with all the teams is so important. Also pandemic on top of that pushed to communicate more, a quick call sometimes helped more than a ping. Brainstorming sessions together with the product team and marketing team helped work through the challenges.
Some buffer time on the project schedule is always helpful
At a startup where everything is so fast paced and one needs to deliver continuously, it is important to keep some buffer time in case anticipated timeline has to be pushed, due to design to development feasibility and organizing various data points.
2020 and pandemic was a challenge and this report resonated with me as well
While working on the design for the report, various data points that were revealed were helpful in understanding that changes in workstyle that as a remote worker i was facing was worldwide being faced and in terms of developer recruitment.


